Measure Dot Gain (DC): Evaluate dot area reproducibility, measure with dot area rate meter, and then calculate by the following formula: DG = (measuring dot area rate) - (film or printing dot area rate)
Measure the effective density ratio (DP) within the network: To find the effective density ratio (DP) within the network, use the dot area rate meter to measure the solid line (curve) as shown in Figure 6-26. The ideal reproduction of the effective density ratio within the dot is the dotted line to represent the cumulative distribution; after printing, the actual degree is not achieved, and the density distribution inside the dot is represented by a curve. DP is used as a reproducibility indicator for evaluating the density in the dot, and is calculated as follows.
DP=Aa/D·a
Where: D - is the density of the field;
Aa—area under the curve;
a—The area ratio of the printing part of the outlet.
Determining the Dot Attachment Density (SD): To evaluate the reproducibility of the dot density at the dot, as shown in Figure 6-26, where the area Ac appears, calculated as follows:
SD=Ac/D×(100-a)
In the formula: Ac—the additional density of dots in the actual print.
At this point, the calculation of the 10 measurement items in Table 6-5 was basically completed.
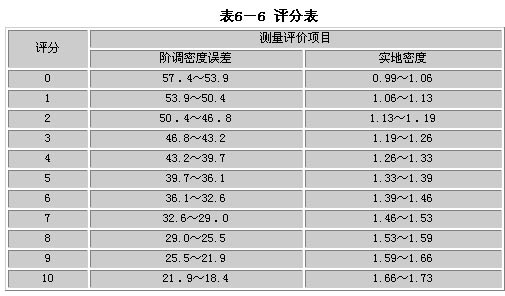
2. Evaluation form. As shown in Fig. 6-23, for the values ​​of the measurement items obtained in step 1, evaluations from 0 to 10 points are given using the scoring method shown in Table 6-6.
Table 6-5 is a calculation table for the overall quality of a printed image. The lower right 1 is the comprehensive quality evaluation score of this print. The full score of the evaluation is 100 points. The actual score of this product is 59.5 points. The accounting sequence is the measurement value corresponding to the measurement item 2 of the serial number 1-10; the measurement value of the two items is converted into a score of 4; the evaluation weight is multiplied by 5 to calculate the score 6 in each item; The scores are summed up, and the overall quality evaluation of printed matter is divided into 1. During this period, the quality assessment points are in the same order as the visual evaluation quality, and the evaluation weight scores can be inversely calculated. For this reason, regression analysis is very useful. The scores in Table 6-5 are obtained by this method.
3. Calculate the quality assessment score. Substituting each measurement evaluation item obtained in the previous step into the evaluation formula of formula (6-5) to obtain the quality evaluation score:
Y=WTE×PTE+WD×PD+WA×PA+WLS×PLS+WLZ×PLZ+WG×PG+WDP×PDP Ten WSD×PSD+WDG×PDG+WSF×PSF (6-5)
In the formula: TE to SF—indicates 10 evaluation items shown in Table 6-5;
W - indicates the degree of importance of the evaluation item indicated by the letter next to it (evaluation weight of 5 in Table 6-5);
P - the required score for Step 2 (Figure 6-23).
The number of scores Y is divided into 100 points. The higher the score, the better the print quality.
W, which expresses the evaluation weight (importance), is listed in Table 6-5 according to the size of its value. In this evaluation, how to set this W, which represents the evaluation weight, is an important key.
Analyze the expected degree of print quality and the relationship between each score item, and obtain the evaluation proportion 5 (important degree) shown in Table 6-5. Here, if we look at the evaluation proportions listed in Table 6-5, we can find the sum of the importance of the four items of the tone density error, the shape factor of the dot, and the increase in the number of dots and dots around the dots. As high as 65%, it can be seen that these four items are particularly important.
In order to check the applicability of this evaluation method, the trial results of this evaluation method are illustrated in Figs. 6-27 and 6-28.
In FIGS. 6-27 and 6-28, the horizontal axis indicates the evaluation scores obtained by this evaluation method, and the vertical axis indicates the visual evaluation scores, and the correlation between the two is compared. In Figure 6-27, the visual inspection print image is a figure (two different designs). Figure 6-28 uses a still life. As can be seen from both figures, the correlation between measurement evaluation and visual inspection evaluation is very strong, and the obtained evaluation method is basically applicable.
In particular, the evaluation proportion shown in Table 6-55, although obtained from the evaluation data of the character pattern, is also applicable to still life, as shown in Fig. 6-28, which is quite interesting.
In order to make the above evaluation method applicable to more printed matters, in order to improve the consistency with the self-test evaluation, further improvements may be made. In this way, when assessing the quality of printed matter, it is no longer only paying attention to dot and density, but these factors are combined to give a quantitative assessment.
(to be continued)
Jigsaw Puzzle,3D Jigsaw Puzzle,3D Puzzle Toys
Baby Potty,Baby Walker Co., Ltd. , http://www.nsbabyproducts.com